
Perfect use for an older Raspberry pi 3B or 3B+ -order one [good luck] -"RPI" is raspberry pi in diagram
"Open Virtualization Architecture Images [ova] now available -using ubuntu 22.04 OS- No need for a raspberry pi!
Check it out: click on image, wait for home page -you can scroll base page -the inside links won't work!
SORRY! Too many people trying to clobber my poor pi SORRY had to disable it!
This is an actual raspberry pi 3B+ running the imonitorg scripts. -It may be slow via your remote access!
This an http site only since it is normally accessed only from within your local network. You will have to exempt to see it.

Imonitorg Mesurements capability Spreadsheet
Important Note: imonitorg is targeted for longer term measurements, NOT second to second. More like minute to minute!

Download image: imonitorg raspberry pi images at sourceforge -burn the microSD
OR! contact me.... I can send you one.
And
then --install microSD in raspberry pi -no initialization needed if
using ethernet [email config additional]
1. Download 3B
or 3B+ image from sourceforge
2. OR Make me do it: Order 32GB
microSD card with raspberry 3B(jessie) or 3B+(stretch) image $50 via
paypal
Very Ugly Order Form
OR! Download the "ova" and install it in your VM [Oracle VirtualBox tested on linux/win10]
QuickManualG -standalone imonitorg -generic pi image, non managed
vboxQuickManualG -standalone imonitorg for VM -"ova" image, non managed
iotsnoopQuickManual IOT monitoring using APN on pi4
Actual rpi web page [scripts off]
Pi Configuration -Raspberry Pi Configuration -for reference
"Guinea pig" performance plots->compare to yours
Trial [managed rpis] customers spreadsheet showing ISPs/access
Summary:
Install a small processor on your network behind your NAT router, just like any PC, via ethernet or wifi. The processor then accesses the Internet and gauges your Internet stability and performance. The processor also collects information about your local network, including hosts, svc ports, changes, IP addresses, boot and network/offline alerts, wifi scans, nmap scans [if enabled]. The results are readable via a web page [on the processor] and a daily email.
Please Note:
For the "imonitorg" images offered on sourceforge, there is absolutely no contact between the image sofware and my servers. References herein to imonitor server -or "managed" rpis, refers to the earlier trial involving 25 friends across the country on different ISPs using the rpis. Those friends were instrumental in helping me develop this service. Additionally, the generic sourceforge images are standard raspberry [raspian] images with std pi username/passwd. You have full access to the rpi.
Special Note summer 2022:
I
know of no similar service. There are lots of attempts at
performance monitoring your Internet connection using fancy graphics,
but this is not one of those. This gives a wealth
of detail on your local network, and your Internet performance.
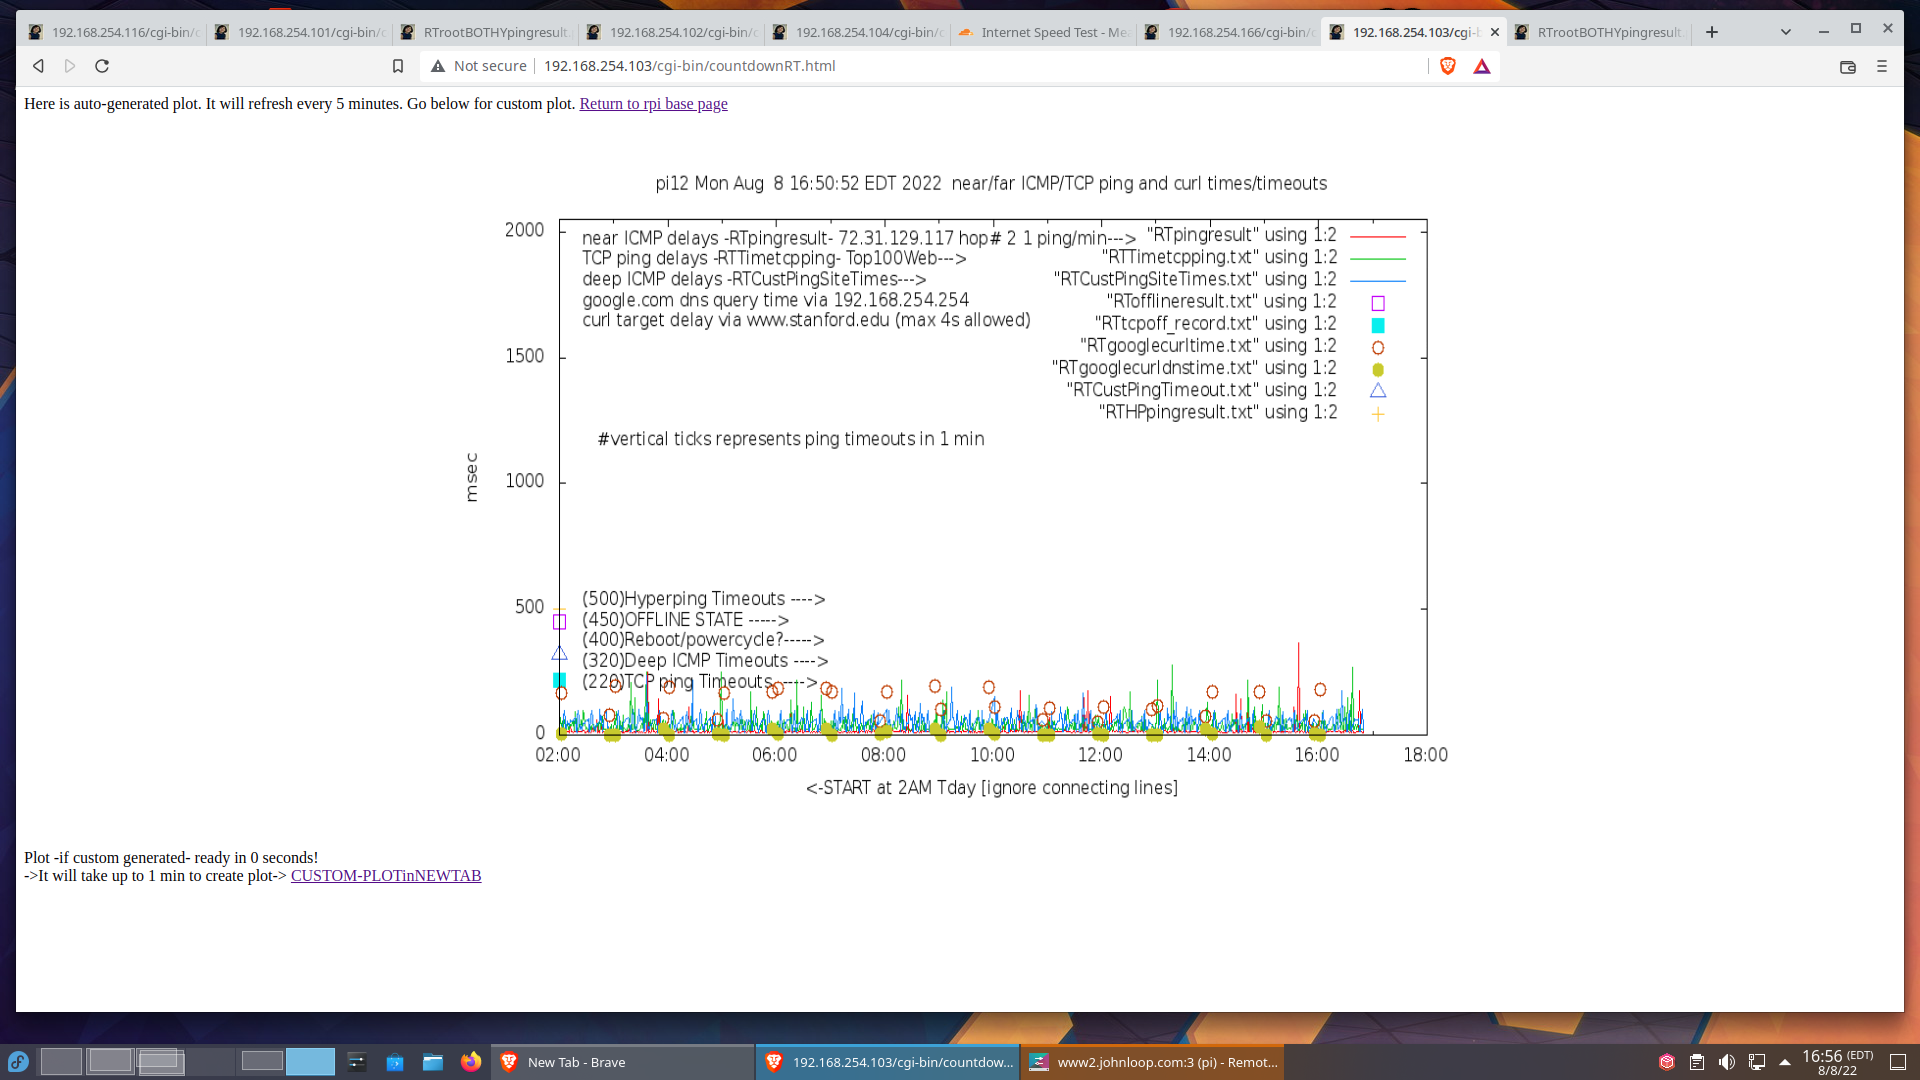
There is also the availability to keep a tab open on your browser and
it will be updated every 5 minutes with a plot representing the
performance for the day. It is a wonderful use for an older rpi 3B
or 3B+
The first plot is a screenshot of the tab that auto refreshes the daily performance.
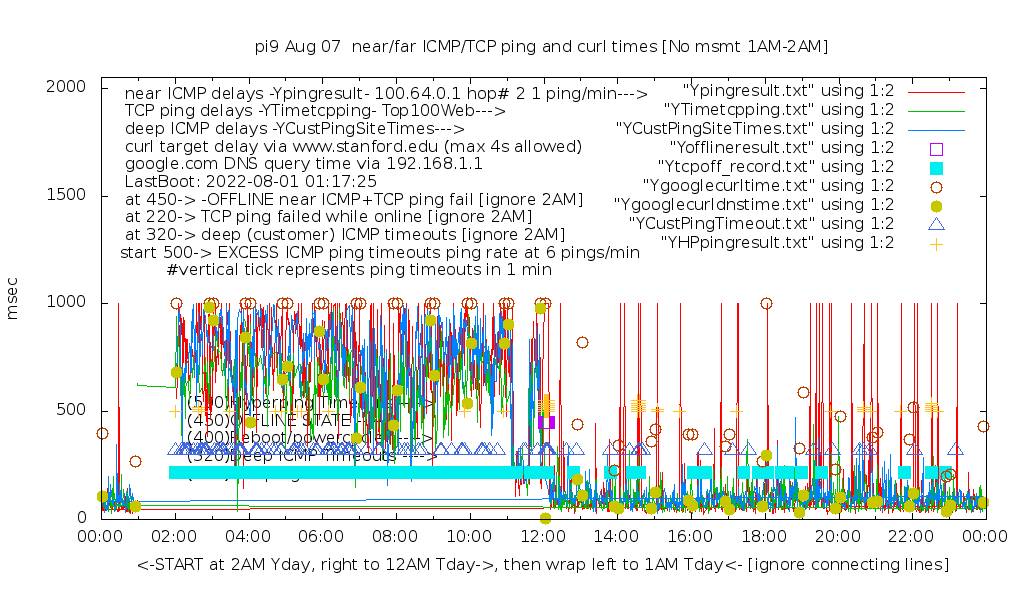
The second screenshot is a wonderful shot when Ernie switched from windstream to Starlink.
The third plot is me uploading my sourceforge image on a link 300MbsDOWN/12MbsUP
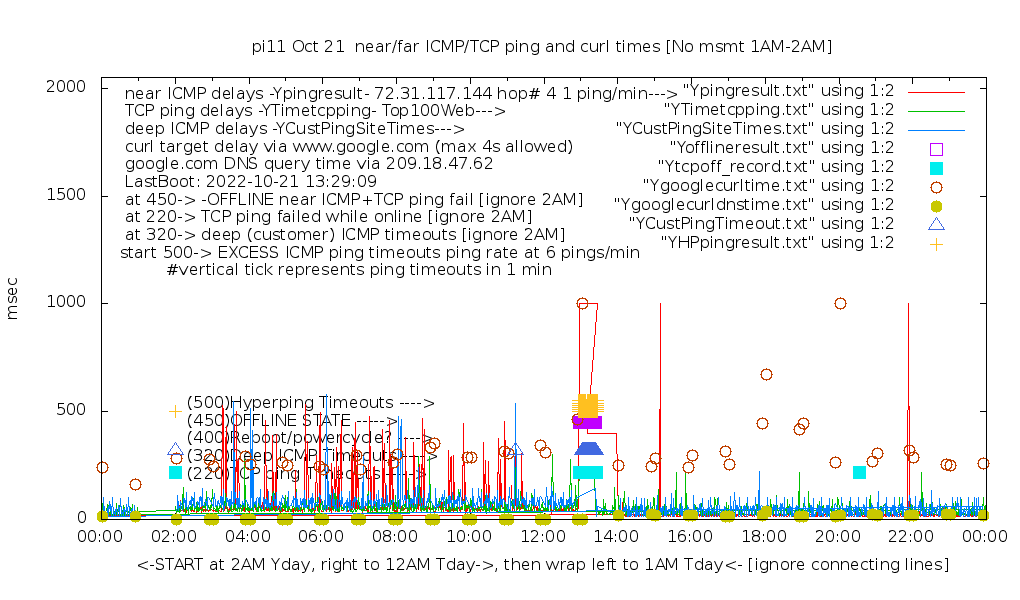
The fourth plot is pi11 switching from Verizon home broadband back to Spectrum cable
The fifth plot shows switching from Spectrum cable to Spectrum hotspot


In General:
In "general" the rpi does longer term msmts. But what is "longer term?" Kinda hard to decide just how to measure. Kinda like taking the temperature of the earth? The internet is a statistically multiplexed thing, and instantaneous speed varies widely until the pipes and processors and programs are all wide open, infinitely capable, and well written -right?! My goal was to take up as little of your bandwidth as possible, and go for longer term msmts. Also, I did NOT want to be "inline" like some of the msmt boxes. My gadget looks just like any other gadget on your network. That being said, this is kinda what I do.
The RPI is doing pings every minute using different protocols. It is not crowding your connection every second with pings and speedtests.
1. It determines the first hop pingable starting at your hop 5 and counting down [this has recently been made configurable as hop 5,4,3 or 2]. Use this as the "near end" ICMP target for the next day. Send one ping packet each minute, and declare timeout if response not received in 1 sec. This shows up as "1000" ms on the plot. This is pure IP, no DNS lookup. One request and one response packet. This is meant to be a gauge of your ISP performance. From 2AM to 1AM next day. This ping target can be LOCKED so it will not be reconfigured. These pings are triggered by a cron each hour, and occur from 2AM until 1AM the next day.
Recently added is a "hyperping." If an ICMP ping timeout is encountered, a script is run wherein the pings increase to 6/minute. If there are timeouts here, a "tic" is displayed on the plot, giving increased info about the severity of the basic 1/min ICMP ping.
2. For the managed pis, each night the imonitor server receives these "near end" ping targets of all the trial people, and then I copy this down to each one. This will be the "deep" ICMP targets for the next day. A ping is sent to the "deep" ICMP target once each minute -lasting about 20 minutes each hour, and it is round robbined between all 20+. This is pure IP, no DNS lookup. One request and one response packet. This is meant to be a gauge of the wider Internet transport performance [no DNS involved] From 2AM to 1AM next day. [This capability is not available on the imonitorg "generic" rpi offered in the sourceforge images]. It is possible to add a special file on generic pis to do this.
3. I have a list of the "top 100 Web sites" and the rpi will do a round robin "TCP ping" of them, one site per minute. This does a DNS query, most likely to your router, which is probably doing DNS caching, before it does the response because it pulls the most data. This curl target is configurable on the rpi web page. This is actually a "half open" SYN, not a full TCP handshake. It amounts to about 5 packets total each minute. These TCP pings most likely are to the nearest CDN [content delivery network]! I plot these times, as well as declare a "tcp offline" -- you can see these square blobs on the plot. Unlike the above two pings, which are called from cron, this is free running from boot [once Internet is acquired] 23 hours a day. The plot will be from 2AM-1AM the next day. This is meant to be a very rough indication of the Internet [including DNS] beyond your ISP.
4. Twice per hour the rpi will do a "curl" of www.google.com [default value] which represents a web browse [tho no images are loaded]. and plot the response time. This is typically the slowest response on the plot. This curl target is configurable on the rpi web page.
5. Twice per hour the rpi will do a DNS query for www.google.com and time the DNS response. This is to your router [a check is performed to make sure he does DNS], who is probably doing caching, and forwarding. This varies widely, but may be the shortest time of all, and is a very base indication of local network and router business. The time should be a few msec, except for when the router needs to refresh its cache. Some ISPs supply their own DNS server as the DNS, in order to acculate DNS stats.
6. Speedtests are run using an "ookla [speedtest.net]" linux script at 3:30PM and 3:30AM. This is the same you get at speedtest.net. Speedtests are notoriously bad indications of short term performance, and they may vary widely, esp on wifi. The archive plots of these is most revealing for longer term.
7. All of these are plotted, and there are archive plots which will report on them cumulatively over the weeks and months. And they are all available on the rpi by browsing to its web server. The web server is simple http, not https, so you may need to make and exception for it in your browser. It is perfectly safe, it is on your network. The address of your rpi is easily obtainable from your router, or it is linked in the daily email. You can configure the email using your gmail address as a relay.
8. The rpi also does a wifi scan of your network, and will scan for hosts and ports open once per day, and report changes day to day [the scan can be disabled]. On managed pis only, once a week the server will do a scan from the Internet side and add that to the email.
Plots will declare an "offline" [and plot it using square blobs] if the script "simultaneously" detects a near ICMP ping timeout and a TCP timeout. "Instantaneous" offlines can sneak in during the minute and the rpi will not catch them, but I figure "maybe" that is not offline? But how do you decide this?
Details: A dedicated small processor - a Raspberry pi3B (Rpi), connected to the LAN side of your Internet router runs a set of scripts to monitor your Internet performance. The amount of traffic is very minimal. See the "Security and Bandwidth" discussion below for details. These statistics are browseable on your local network - via a webserver on the rpi. A summary of the stats is also taken and emailed to you every morning. For the managed rpis, a vulnerability scan of your IP address - your location on the internet is added on Saturday. The stats include scanning of visible wifi networks, and also -if you choose to add the Rpi to your local wifi network- performance stats of the inside wifi network. For the generic sourceforge images, the email uses your gmail address as a relay. The parameters are configurable on the rpi web page.
Many details about your local network are also collected and displayed.
In no case is the rpi collecting any of your packets - these are stats generated from traffic it generates on the rpi.
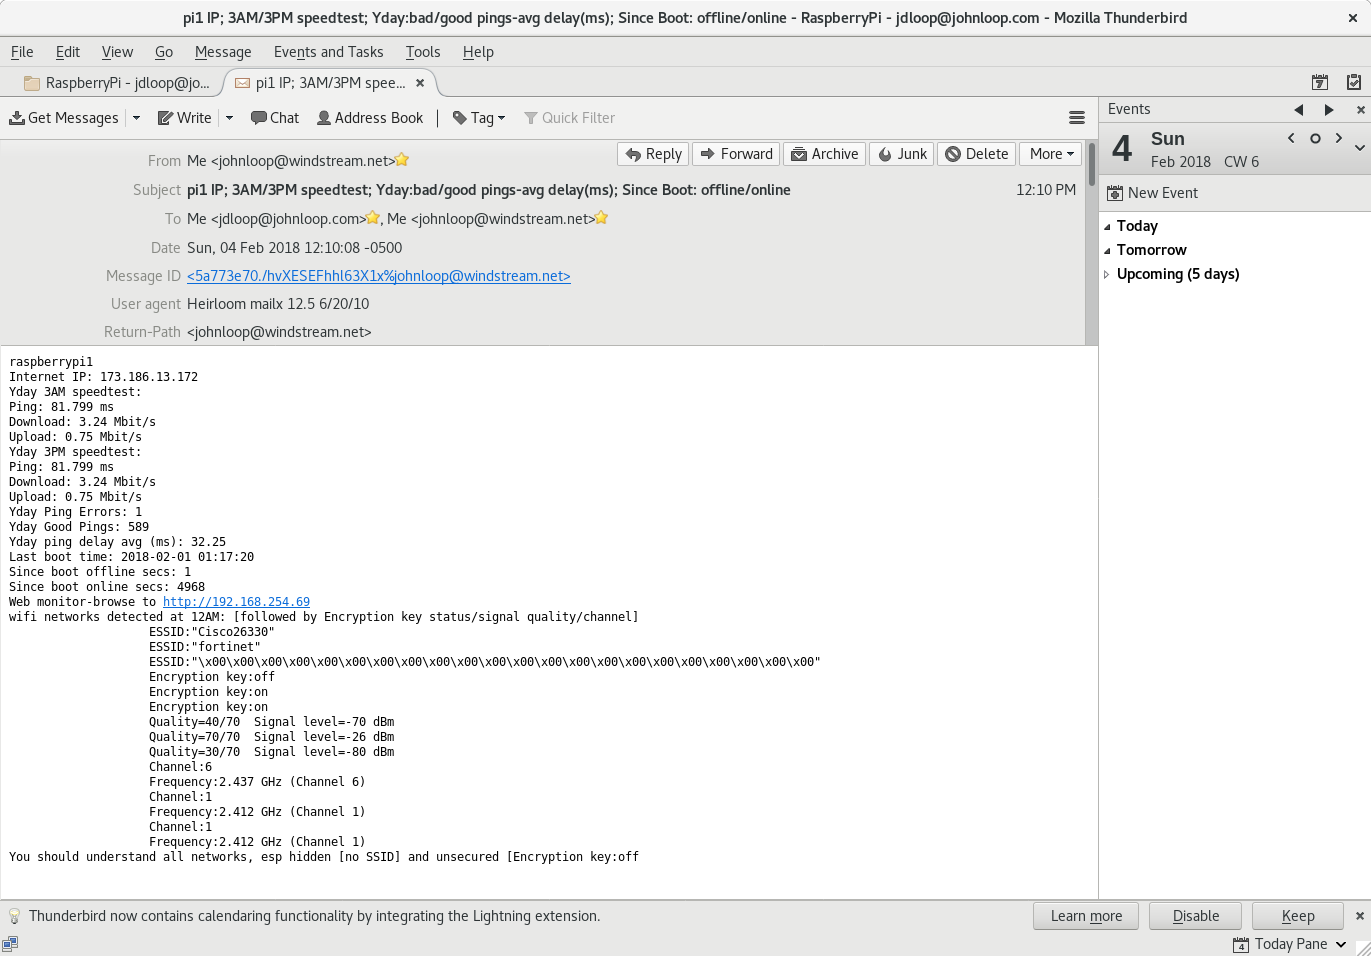
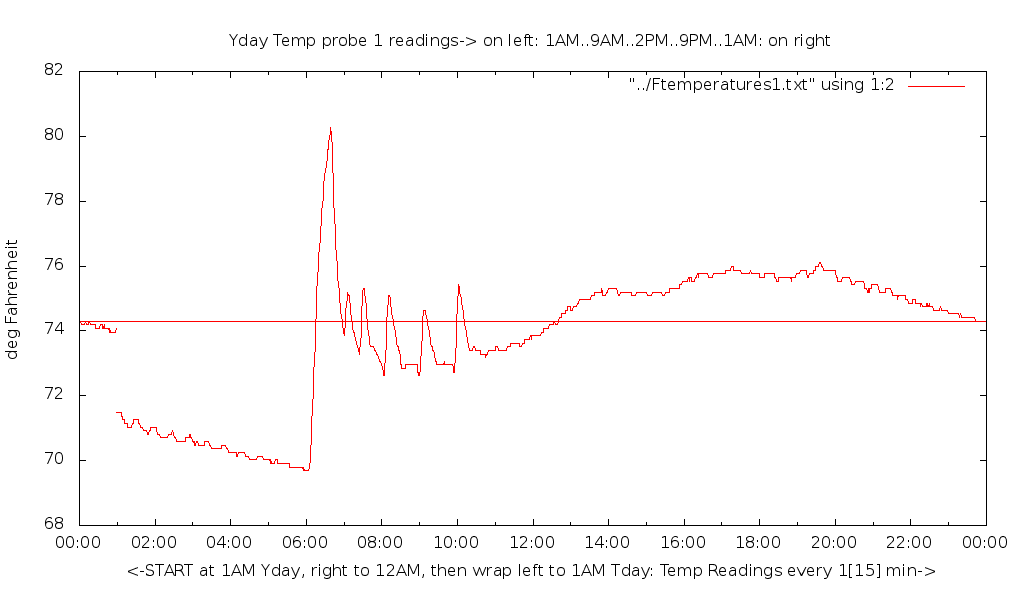
Here is a sample web page resulting from browsing to the rpi address -on your local network [click on it to enlarge]. The next figure is an email generated by the rpi and sent to the user's email account. I also show a picture of the rpi, on top of a linksys router, and the ICMP ping delay and tcp delay plots. The final plot is a daily temperature plot, if you have the temperature probe attached and enabled. The plots are under continual improvement for interpreting data.


The rpi can do both ethernet and wifi network monitoring. Typically the rpi ethernet is connected directly to the home router. The rpi wifi will also monitor the in-house wifi network -if added to the local wifi network. The rpi can be connected via wifi or ethernet, or both, and will do performance monitoring of both. Direct ethernet connection of the rpi is preferred, but it can connect via wifi, if SSID/key are added. The pi always selects the ethernet interface for the default path if it is enabled and configured.
Reference, for people on Jasper, GA Mountain to obtain ISP paths:
Windstream
Peering Locations showing Atlanta Digital Reality at 56 Marietta
St
Digital Reality
IXC at Atlanta showing Windstream at 198.32.132.1 or 121
There are three tests that are run each minute.
The ICMP and TCP ping scripts ping by IP address and by name, respectively. The ICMP ping scripts start each morning at 2AM and run till 1AM the next morning. The ICMP ping target is automatically configured and set every night as the 5th hop or next closest one pingable using a traceroute. As an alternative to "automatic," the ICMP ping target is configurable on the web interface, and also the capability to "lock" it. The hop start is also configurable. It defaults to 4. . The TCP ping script runs continually from boot of the Rpi, as long as the Rpi is determined "online." The target is pinged every minute by name. The main ICMP ping is to a near target to gauge “ISP” performance. The second ICMP ping [only available on managed pis as the "customer pings"] is to a “deep” target. Generic pis can also configure a customer ping list.
Daily plots of these ping tests are provided, archived, and linked in the daily email.
The third test runs for a month to gauge "online/offline" status. Every minute of each day, for 24 hours, TCP connectivity is verified to the TCP ping target, and the errors are accumulated commencing at the start of the month. It thus represent the fact that your DNS server is responding and that target is in fact browsable. This represents a higher level type of test. The counters bridge Internet outages and increment the counter while google.com [e.g.] is not browsable. For failures, a traceroute is performed to give an indication of the problem – local or remote. This connect target [default www.google.com] is also configurable.
The first two tests represent low level tests to "near" targets and can represent ISP performance. The third "online" test is to a "deeper" Internet target.
A speedtest is performed at 3:30AM and at 3:30PM. These results are archived and a cumulative plot of them is provided [and linked in the daily email].
A weekly scan of your Internet IP is performed from the management server at night [only for managed rpis].
A scan of your internal network is performed from the rpi -if enabled- at night. This can be especially valuable if you live in a wifi maze.
The Rpi is rebooted at the start of each month and monthly accounting is performed.
By browsing to the web server of the rpi, a screen showing this summary info is presented. The rpi IP address is reported in the daily email --the user may simply click on the link in the email to go to the rpi web server. This is a perfectly safe link to click on ---it is on your local network.
Statistics collected.
1. Speedtest 3AM benchmarks. This is a record of speedtests, recorded every night at 3:35AM.
2.
Speedtest 3PM benchmarks. This is a record of speedtests,
recorded every day at 3:35PM.
3. Record of IP address changes
with dates. -configurable via the browser.
4. Current IP
address --this is reported every 10 minutes. This thus
provides a service like dyndns. This is your INTERNET IP
address.
5. Record of "boot times" of the rpi.
This represents a record of power outages [at least on the circuit
the pi is plugged into]. This will normally only record the
monthly reboot on the 1st.
6. A running record of ping responses
to a "near" ISP target. A file will record successful pings
-59 per hour if successful, 1357 if making it thru a whole day. The
hour 1AM to 2AM is not tested - it is used as housekeeping and
retrieval. Using IP address only [no DNS lookup].
7. 6
previous day statistics records will be available as
"1dayprevious.tar" etc. These are archives, viewable on
windows or linux.
8. In addition to the weekly archive,
there is a monthly archive of important stats.
9. A record of
ping delays for the 23 hours, and for yesterday 23 hours. Plots are
available.
10. A running record of TCP connection successes to a configurable site [www.google.com or www.msftnsci.com are suggested] using name acquired via DNS query. These are recorded every minute from time of boot of the rpi. It thus represents a "higher" level of connectivity.
11. A record of the last wifi scan listing network SSIDs, encryption status and signal levels. It is not necessary that the rpi participate in your wifi to see this.
12.
13. A record of the last vulnerability scan performed on your internal network [if enabled].
14. A daily scan of your internal network listing hosts and common service ports [if enabled]
15. A historical record of the arp cache which will show every network device ever on your network.
How this works:
A small processor, known as a raspberry pi3 B [B+ in latest version] (rpi) (see info here: RpiUserGuide OverviewDoc) is connected via ethernet [and/or wifi], to your network at the exit point, either at the ADSL[cable/satellite/cellular/wireless] router, or the switch which serves it. [you may also connect it behind an intervening router, as long as its default Internet path is provided]. It expects an IP address, a gateway and a DNS server from your private network, and will thus appear on your network much like any of your devices, including accessing the Internet. Bash scripts are executed on the rpi which access the Internet, and -in concert with scripts on the mgmt server site [for managed rpis]- present the data via a web page and a daily email. There is no attempt to access any device or monitor any of your private traffic within your own network [see discussion later -this is not in general doable]. The individual rpis are always running and collecting data as long as they have power. You might want to consider putting them on a UPS along with your other important electronics. A wired connection to your router is normal, but a wifi connection can also be used, in addition to, or instead of the wired connection. You can import the wifi key to the rpi if you desire for -IP- wifi monitoring, but this is not necessary].
The rpi uses the simple webserver “lighttpd” to allow local browsing of the statistics. Using the IP address provided in the morning email [such as "browse to http://192.168.254.13"], you can browse to your rpi webroot directly from a PC on your network and get these detailed stats. This is a perfectly safe link, internal to your network. The daily email presents a summary of those stats, along with an Internet vulnerability scan.
There is nothing unique about this service, except that I am targeting it for a small audience and using completely local equipment. I am basically developing and running this service for my own "enjoyment" and interest. I am using my own servers and my own Internet service, currently just the basic Spectrum cable in FL. Each Rpi costs $65 which gets me the circuit board and mounting hardware and cables. I then import the configurations and scripts to the raspberry pi and my mgmt server to support it. This comment applies to the managed rpis. The generic images posted on sourceforge have absolutely no connection my mgmt server at all.
Because of the statistical nature of the Internet, there is really no way to measure "instantaneous" performance. We can only gauge longer term performance, which is REALLY lacking right now. This service should put some quantitative measures on the "my Internet is always down" or "my Internet wasn't working this morning." This "Internet monitoring service" attempts to address this issue, especially as we develop the service going forward. The ping data is all archived in the plot files. You can browse daily plots of your ping delays for many previous months [it is planned to cap this at 1 year].
Almost all of the parameters are configurable by redefining "DEF.txt" parameters in the root directory of the rpi -I normally configure these, but can give you access. You may configure the ping, connect and route targets directly on the web page -without root access.
Perhaps the most useful features is the daily email. I summarize performance for the previous day, so you can get a quick snapshot, and I provide direct links to the perf plots on the rpi. I also report on the wifi networks visible and the vulnerability of your Internet connection. The web page presents much more detail, including the ability to see individual minute to minute ping response times.
Security and Bandwidth Considerations.
I
always have a document explaining the
operation of
the scripts:
OverviewDoc.
The
rpi
in no way monitors
your
LAN activities
-or collects
your traffic
occurring
on your network. The scope and extent of this service impacts
your bandwidth hardly at all.
This
is not one of the infamous devices [these days] that "phones
home" -- like your web connected camera that connects to a
server, most likely in China, to enable it to be ID'd by an app so
you can browse to your home camera by your iphone/android device.
These are causing ALL sorts of problem on the Internet these days ...
viz "IoT - Internet of things" - see this
link just as an FYI. If you have one of these cameras
on your web, and it is using UPNP especially [and your router allows
this!] [to allow access to/from the Internet], PLEASE give it a
secure passwd. If it still has the default passwd, you are most
likely being used by Internet lowlife to perform DDOS attacks, such
as the one experienced by Brian as noted
here. Another
Link explaining access to the cameras/IoTs.
For
the nerds.... For
the managed rpis, the
mgmt server is utilized.
The
rpi
performs an outgoing ssh session to the mgmt server, and then
requests the mgmt server to open a connection back to the rpi
[only!] via the already opened [outbound] session, using the
localhost address. This is called a "reverse ssh session" -
using the existing outbound connection. There is no
port/nothing accessible on your network from the Internet [due to the
rpi],
except by the mgmt server over the reverse ssh connection. You
can elect to disable this access, but as long as you are a "guinea
pig" you must allow me occasional access to update. As a general
check on the invisibility [and therefore the
"unhackability"]
of your network, you should go to this
link and perform a check --you should find no ports open.
And uPNP should not be detected! Do this from one
of your PCs after you
connect
the rpi
[and after it is connected to the mgmt server] to verify this.
For the nerds again.... As long as you connect the rpi to a cascaded "switch" [instead of a "hub"] or an extra LAN port directly on the [ADSL, cable modem, satellite] router, the rpi will see only the broadcast traffic in your network. Since they don't sell hubs anymore.... the chances of you encountering one are slim. The broadcast traffic is largely the arp traffic [tell me the MAC for this IP], the DHCP request/renewal [please renew my IP address], or the multicast traffic. Even when you put the network interface into promiscuous mode, this only means that all the packets hitting the NIC are passed to the processor -only the ones with this NIC's MAC address -or the broadcast address. So the use of a switch prevents the rpi from seeing its [non broadcast] neighbor's traffic. You can go in and actually do a "tcpdump" on the ethernet to see what the rpi can actually see. [you probably need to install tcpdump.] Or..... you can connect up a KVM to the Rpi [HDMI term, usb keyboard/mouse], and have a desktop. You can probably install wireshark there. Have at it!! Just don't mess with my scripts!! They run under user pi, and a few under root.
It is also possible to connect the rpi behind a second router in your network, thus isolating the rpi from your main network. Or, if your main network is behind the second router, put the rpi directly on the Internet router. In either case, the rpi can reach the Internet and perform the statistics collection.
For the nerds again.... It is conceivable of course that I am filling the rpi full of malware which will originate attacks on your network. If you run tcpdump, you will be able to see everything originated from the rpi, and this should obviate any concern here. You should only see outgoing [Internet, via your gateway] traffic.
The other potential avenue for snooping is the wifi NIC on the rpi. Wifi is a broadcast medium -all the packets are in the air, unlike the individual ethernet wire. In order for the rpi to snoop your network, it will need the key for the wifi SSID, which is typically set in the router. You can change this at your convenience to alleviate any concern. In addition you may disable the wifi connection and monitoring, leaving only the ethernet. This will insure no potential snooping.
The use of the wifi is only necessary if you are not able to provide an Ethernet connection. Some people will want to use the wifi for the connection however, especially if they only use wifi in the house. The rpi is configured to do wifi monitoring [if on your network] to your router, but this is a secondary purpose.
The initial implementation of the "imonitor" required management access to allow development and update of the rpi. These are the "managed" rpis and 25 friends have volunteered to enable this development. These are across the country on different ISPs.
As of 2022 there is an "imonitorg" rpi image I am making available on sourceforge which will run completely standalone and will have no ability to connect with the management server. This version can use the user's gmail account as a relay to receive a daily status report, much like the "imonitor." Please contact me at jdloop@johnloop.com for information if desired.
The "missing" features in the imonitorg are as follows:
1. No alert emails. The gmail relay can be configured for daily status email, where alerts are shown.
2. No Internet scan performed and relayed with email
3. No shodan scan performed and relayed with email
4. There is no "deep" ICMP scan, since this would use other customer IPs.
5. No "mgmt" server of course.
All the scans and stats and plots are retained on the imonitorg and available via the rpi web page, just as with the imonitor.
All rpis have the pihole application installed. This is linked from the main rpi screen -https://rpi_IPadd/admin/index.php- As installed, it will monitor the network and record hardware devices faithfully. If you configure a network device to use the pihole as a DNS server, it will record all DNS queries. By the use of lists servers, it will also block [and whitelist] domains. Primarily use to black-hole ad domains. It is a wonderful device to use on your network to monitor DNS activity. You will have to disable DNS over https for Firefox.
As installed, pihole is not configured to use blacklists - it will record all DNS activity. This is a tremendous resource.
In most cases, I expect this service to be used on ADSL or cable service lines. ADSL typically uses ADSL2+ --Info-- The service can use one or two pairs of telephone wires. Two pair ADSL -bonded service- can give up to 24Mbs downstream rate. A cable service typically gives 40Mbs downstream, tho it uses a shared medium unlike the ADSL technology.
The rpi can be connected behind any sort of Internet service however. I also use[d] it on a Hughes Satellite connection and a StarLink connection. It just needs an Ethernet interface and the ability to acquire an IP address, gateway and DNS from the Internet router. It should not be used on true Internet addresses, but should be used on a NAT'd connection [behind your router], since there is no firewall running on the rpi. It can even be used on Hughes satellite connections, which are a NAT in the Internet [you do not have an IP addressable on the Internet - you cannot run services], since I do a reverse ssh from the Rpi.
The imonitor service/rpi of course works at layer 3 and does not know about the layer 1 technology used in the WAN, but the service is most commonly deployed on customer ADSL lines or cable modems. It can be deployed at any layer 3 interface with access to the Internet.
A temperature sensor can be added to the Rpi3. Scripts are included to sample this temperature every 15 minutes and save the previous day's records. The Rpi3 web page provides a way to set a "temp down limit" and a "temp up limit." If either limit is exceeded, 10 emails are generated to the default customer email.